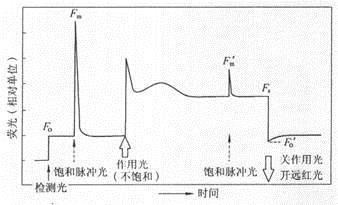
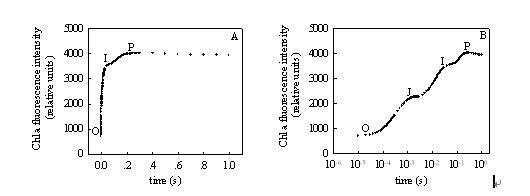
Similarities and differences between chlorophyll fluorescence kinetics curves and fast chlorophyll fluorescence induction kinetic curves As early as 1931, Kautsky and Hirsh recognized the close relationship between photosynthetic primary reaction and chlorophyll fluorescence. For the first time, they reported that after dark-adapted photosynthetic materials, chlorophyll fluorescence quickly rose to a maximum, then gradually decreased, and finally reached a stable value. Since then, as the research progressed, people gradually realized that there is a wealth of information in the fluorescence induction kinetic curve. Chlorophyll fluorescence kinetics curve: Figure 1. Chlorophyll fluorescence kinetics of fluorescence parameters measured by pulse-modulated fluorometer (Note: quoted from Xu Daquan, "Photosynthetic Efficiency" 2002) The typical chlorophyll fluorescence kinetic curve is the portion of the curve from the back of the action light to the second saturated pulsed light in Figure 1. The entire curve in Figure 1 is used to calculate all the fluorescence parameters, and the reaction center is turned off by turning on the saturated pulsed light at different times. Obtain special fluorescence parameters. From the chlorophyll fluorescence kinetic curve, we mainly obtain the original photochemical reaction, as well as the actual photochemical efficiency and absorption and utilization of light energy after photosynthetic initiation. Pulse modulation fluorometer, no matter how many fluorescence parameters can be measured by the merchant, what is most important is the five basic parameters measured in Figure 1, all other parameters are calculated based on these five basic parameters. Fully dark-adapted leaves, under very weak detection light, the minimum fluorescence FO is determined, at which time all reaction centers are open; then the saturation fluorescence (0.7s) is turned on to measure the maximum fluorescence Fm, at which time all reaction centers are at Closed state; wait for a few seconds, turn on the action light, then the fluorescence rises, then with the start of photosynthesis, the fluorescence gradually reaches a steady state, the steady-state fluorescence Fs measured after the fluorescence reaches steady state; the fluorescence reaches steady state and then turns on. The saturation pulsed light measures the maximum fluorescence Fm' under the light; then the action light is turned off, and the far-red light is turned on to measure the fluorescence parameter Fo'. Using these five basic parameters, we calculate the parameters measured by the pulse modulation fluorometer we saw in the literature. The calculation formula is as follows: Maximum quantum yield of PSII under dark adaptation [FV/FM=(FM-FO)/FM]; Maximum quantum yield of PSII under light adaptation [FV'/FM'= (FM'-FO')/FM']; The ratio of open PSII reaction centers under light adaptation [qP=(FM'-FS)/(FM'-FO')]; Actual photochemical efficiency of PSII under light adaptation [ΦPSII=(FM'-FS)/FM'] (Genty et al. 1989); Non-photochemical quenching under light adaptation [NPQ=FM/FM'-1] (Demmig-Adams and Adams 1996), etc. Other parameters that can be seen are also calculated from these five basic parameters. Rapid chlorophyll fluorescence induction kinetics curve: Figure 2 shows the fast chlorophyll fluorescence induction kinetics curve measured by a continuous excitation fluorometer (Figure A: time coordinates are linear; Figure B: time coordinates are logarithmic) (Note: cited in Li Pengmin et al. "Application of rapid chlorophyll fluorescence induction kinetics analysis in photosynthesis research") Figure 2 is a typical fast chlorophyll fluorescence induction kinetics curve, also known as the OJIP curve. The determination of this curve requires a very high resolution of the instrument, recording more than 100,000 times per second. In order to get better information from the curve, we usually change the time coordinate to logarithmic form (Figure 2B). At present, only the Handy PEA plant efficiency analyzer from Hanshatech, UK, can measure the complete fast chlorophyll fluorescence induction kinetics curve. From the fast chlorophyll fluorescence induction kinetic curve, we can get more than fifty fluorescence parameters. By analyzing the parameters on the curve, we can understand the original photochemical reaction of PSII and the structure and function of PSII. Mainly used in stress physiology, genetic breeding (Maldonado-Rodriguez et al 2003), pest control (Bueno et al 2004) and pollution detection (Appenroth et al 2001, Hermans et al 2003). We have reason to believe that with the further development of this theory, rapid chlorophyll fluorescence induction kinetics will be more widely used in more research fields. Table 1 Formulation and the terms of the rapid chlorophyll fluorescence induction kinetics (OJIP) used in the JIP-test in the JIP-test in the analysis of the OJIP fluorescence transient Parameters directly obtained from the OJIP fast chlorophyll fluorescence induction kinetic curve Ft Fluorescence intensity at dark time after dark adaptation F50μs or F20μs Fluorescence intensity measured with PEA after dark adaptation for 50 μs or with Handy-PEA after dark adaptation for 20 μs F100μs Fluorescence intensity at 100 μs after dark adaptation F300μs Fluorescence intensity at 300 μs after dark adaptation FJ≡F2ms Fluorescence intensity at point J (2ms) of the OJIP fluorescence induction curve (Fig. 1B) FI≡F30ms Fluorescence intensity at point I (30ms) of the OJIP fluorescence induction curve (Fig. 1B) FP Fluorescence intensity at the maximum fluorescence (P point) of the OJIP fluorescence induction curve (Figure 1B) tFM Time from dark adaptation to light up to maximum fluorescence Area OJIP fluorescence induction curve (Fig. 1B), fluorescence intensity F = FM and area between y axes Other parameters derived from direct parameter acquisition FO≌F50μs or ≌F20μs Fluorescence when all reaction centers are completely open, ie the minimum fluorescence intensity after dark adaptation FM= FP Fluorescence when all reaction centers are completely closed, ie maximum fluorescence intensity after dark adaptation FV≡Ft- FO Variable fluorescence intensity at t Vt≡(Ft- FO)/( FM- FO) Relative variable fluorescence intensity at t VJ≡(FJ-FO)/( FM- FO) Relative variable fluorescence intensity at point J MO≡4(F300μs-FO)/( FM- FO) Initial slope of the OJIP fluorescence induction curve (Figure 1B) Sm≡(Area)/( FM- FO) Normalized OJIP fluorescence induction curve (Fig. 1B), fluorescence intensity F = FM and area between y axes SS= VJ/MO Fluorescent rising complementary area normalized by OJ phase N≡Sm/ SS= Sm•MO•(1/ VJ) The number of times QA was restored from the time of starting the illumination to the time of reaching FM Specific activity parameter (the activity of the unit PSII reaction center when QA is in the reducible state) ABS/RC= MO•(1/ VJ)•(1/φPo) Light energy absorbed by the unit reaction center TRO/RC= MO•(1/ VJ) The energy captured by the unit reaction center for reducing QA (at t=0) ETO/RC= MO•(1/ VJ)•ψO Energy captured by the unit reaction center for electron transfer (at t=0) DIO/RC= (ABS/RC)- (TRO/RC) Energy dissipated by the unit reaction center (at t=0) Quantum yield or energy distribution ratio φPo≡TRO/ABS= [ 1-(FO/FM)] Maximum photochemical efficiency (at t=0) ψO≡ETO/TRO= (1-VJ) The excitons occupied by the excitons captured in the reaction center to push electrons to other electron acceptors in the electron transport chain beyond QA to promote the ratio of QA reductive excitons (at t=0) φEo≡ETO/ABS= [1-(FO/FM)]•ψO Quantum yield for electron transfer (at t=0) φDo≡1-φPo= (FO/FM) Quantum ratio for heat dissipation (at t=0) Specific activity parameter (activity of unit cross-sectional area of ​​illuminating material) ABS/CSO≈FO Light energy absorbed per unit area (at t=0) ABS/CSM≈FM Light energy absorbed per unit area (at t=tFM) TRO/CSO= φPo•(ABS/CSO) TRO/CSM= φPo•(ABS/CSM) Light energy captured per unit area (at t=0) Light energy captured per unit area (at t=tFM) ETO/CSO= φEo•(ABS/CSO) ETO/CSM= φEo•(ABS/CSM) Quantum yield per unit area of ​​electron transfer (at t=0) Quantum yield per unit area of ​​electron transfer (at t=tFM) DIO/CSO= (ABS/CSO) - (TRO/CSO) DIO/CSM= (ABS/CSM) - (TRO/CSM) Heat dissipation per unit area (at t=0) Heat dissipation per unit area (at t=tFM) Density of the reaction center RC/CSO= φPo•(VJ/MO)•(ABS/CSO) RC/CSM= φPo•(VJ/MO)•(ABS/CSM) The number of reaction centers per unit area (at t=0) Number of reaction centers per unit area (at t=tFM) Performance index PIABS≡(RC/ABS)•[φPo/(1-φPo)]•[ψO/(1-ψO)] Performance index based on absorbed light energy PICS≡(RC/CSO)•[φPo/(1-φPo)]•[ψO/(1-ψO)] PICS≡(RC/CSM)•[φPo/(1-φPo)]•[ψO/(1-ψO)] Performance index based on unit area (at t=0) Performance index per unit area (at t=tFM) Driving force (logarithm of performance index) DFABS≡log (PIABS) Driving force based on absorption of light energy DFCS≡log(PICS) Driving force based on unit material area references: Appenroth KJ, Stöckel J, Srivastava A, Strasser RJ (2001). Multiple effects of chromate on the photosynthetic apparatus of Spirodela polyrhizaas probed by OJIP chlorophyll a fluorescence measurements. Environ Pollut, 115:49-64 Bueno M, Fillat MF, Strasser RJ, Maldonado-Rodriguez R, Marina N, Smienk H, Gómez-Moreno C, Barja F (2004). Effects of lindane on the photosynthetic apparatus of the cyanobacteriumAnabaena.Environ Sci Pollut Res, 11:98 -106 Maldonado-Rodriguez R, Pavlov S, Gonzalez A, Oukarroum A, Strasser RJ (2003). Can machines recognise stress in plants? Environ Chem Lett, 1: 201-205 Genty B, Briantais JM, Baker NR (1989). The relationship between the quantum yield of photosynthetic electron transport and quenching of chlorophyll fluorescence. Biochim Biophys Acta, 990:87-92 Demmig-Adams B, Adams WWIII (1996). Xanthophyll cycle and light stress in nature: uniform response to excess direct sunlight among higher plant species. Planta, 198: 460-470 Li Pengmin, Gao Huiyuan, Strasser R J. Application of rapid chlorophyll fluorescence induction kinetics analysis in photosynthesis research. Journal of Plant Physiology and Molecular Biology, 2005, 31(6): 559-566 Li PM, Gao HY, Strasser RJ. Application of the chlorophyll fluorescence Induction dynamics in photosynthesis study. Journal of Plant Physiology and Molecular Biology, 2005, 31(6): 559-566 Xu Daquan. Photosynthesis Efficiency. Shanghai: Shanghai Science and Technology Press, 2002 Hair Scissors Set,6.0 Inch Barber Scissors,440C 440C Hair Scissors,Professional Hair Scissors Heb Zhangjiagang Mister Tools Co., Ltd , https://www.mingshiscissors.com